In this article we will be going over all of the different parts that go into creating a report and what they all mean. This is going to be broken up into six different parts based on the six largest parts of report making, the basics, the module tree, the fields sidebar, the fields tab, the conditions tab and the charts tab. You can jump to each of these different sections in the table of contacts on the side if the article.
Basic Tab
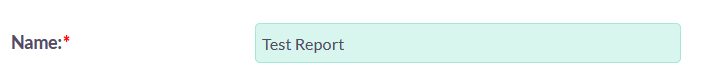
Name - In the Name textbox we will be entering the name of our report
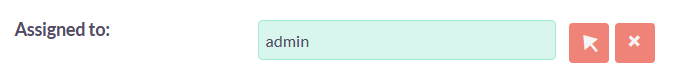
Assigned to - In the Assigned to textbox we can add who created this report. Simply type the name of the person who created the report into the textbox. Or we can click on the white arrow in the blue box and look up the name in the pop-up that appears.
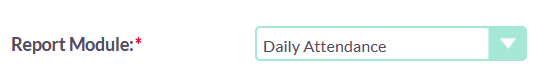
Report Module - Here we can select the module that our report is going to be based on. For example if we wanted to report based on member attendance, we would choose the Daily Attendance module.
Charts per Row - We can select the number of charts that we want per row. DISCLAIMER We will not be using charts in our reports the majority of the time feel free to skip over this textbox when creating a report as it not relevant

Module Tree
Module tree - In the module tree tab there will be the main report module that we chose earlier, and a Contacts module
The other module trees like “Group Activity” "Security Groups", "Assigned to User", "Created by User", and "Modified by User" are not necessary for creating reports and should NEVER be used.
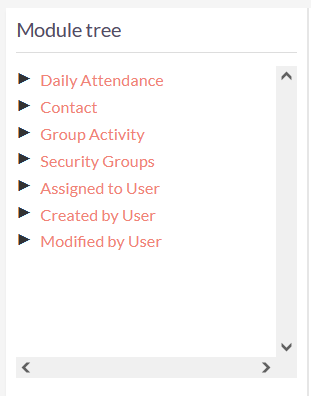
Clicking on an option in the module tree will show all of the fields that are in that module for us to use in that report.These fields can be found in the box below labeled “Fields” below.
Fields Sidebar
Fields - In the box under "Module tree" is the box named fields, this box will be full of all of the fields that are in the module, changing the module that you have selected in the “Module Tree” box will change the fields that are shown.
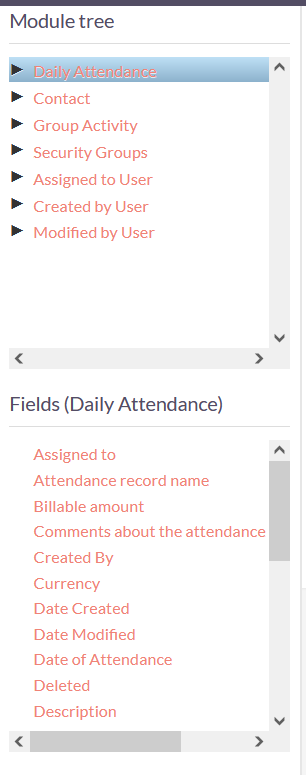
Here we have selected the “Daily Attendance” Module in the Module Tree and are being show the “daily Attendance” fields in the Fields box.
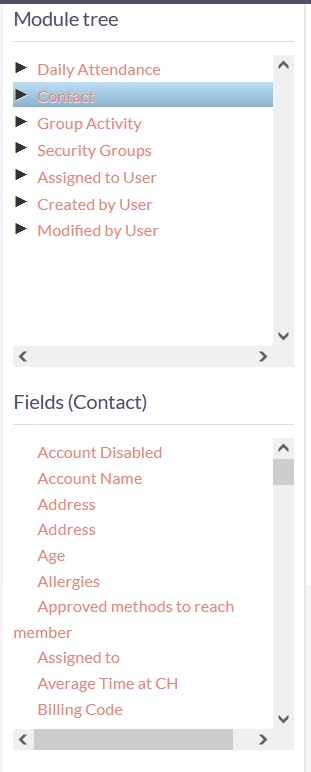
Here we have selected the “Contact” Module in the Module Tree and are being show the “Contact” fields in the Fields box.
Notice how the name of the Fields sidebar changes depending on what module is selected in the Module Tree, this is important as it lets us know where our fields are from.
Fields (Main) Tab
Once we click on a field to add to our report, it will show up under our fields tab. These reflect the information that will be shown in our report.
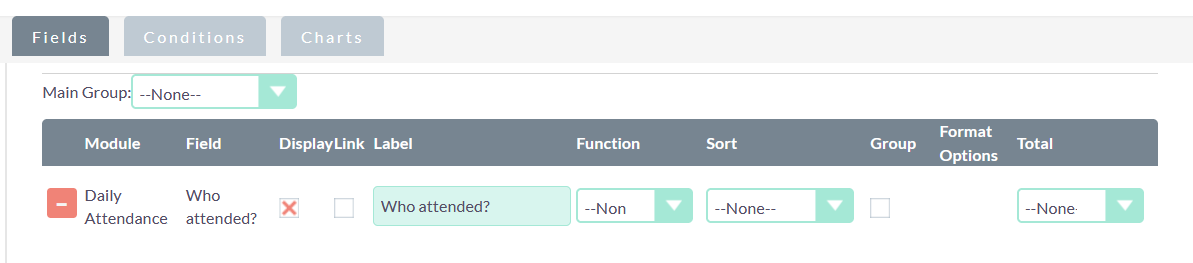
Lets break down the information being show above.
The minus sign next to the row lets us delete the field from our report
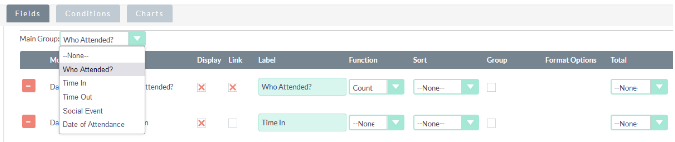
Main Group - This drop down will affect the output of the report. This will give us the option to group the report using ONE of the fields in our report.
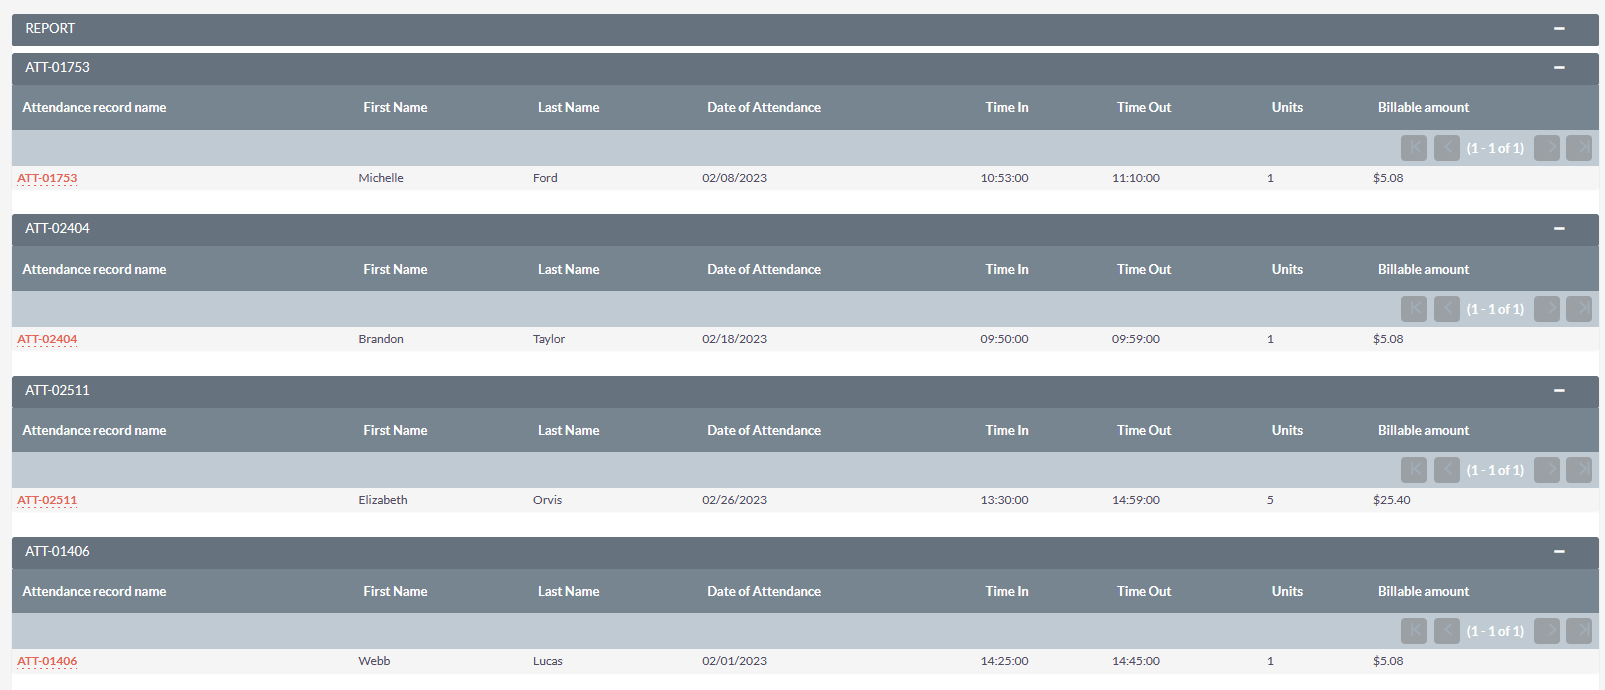
This is what the report would look like if we grouped by the first field.
Module - This lets us know what module our field is from
Field - This lets us know the name of the field
Display - This checkbox allows us too make sure that the field is visible in the report, if unchecked the field will not be visible in the report.
Link - This makes the field a link in the report that will take you to that specific entry/ record in the module. NOTE: this will take you away from the report screen and will NOT open another window.
Label - This is the name that the field will be displayed under in the report. You can change it by deleting and entering in new text, but we recommend not doing so as it can cause confusion later down the line.
Function Options - You have five options : Count, Minimum, Maximum, Sum and Average. You can select any of these options to have the report calculate them automatically within the report. NOTE: This only works with fields that deal with numbers.
Sort - Ascending or Descending. Allows you to select whether to sort the field/column descending or ascending.
Group - Allows you to group by this field. (This option will rarely be used).
Total - You have three options : Count, Sum and Average. You can select any of these options to have the report calculate them automatically within the report. NOTE: This only works with fields that deal with numbers like the amount or minutes in a meeting or how long a member has been with the clubhouse it will NOT work for dates.
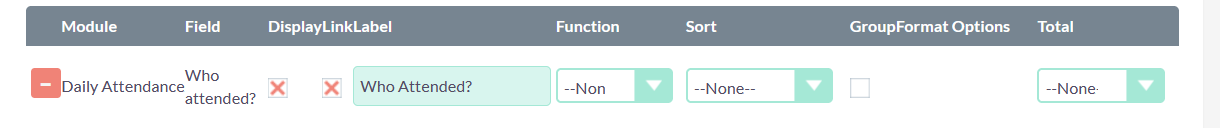
So to put all of this information together this means that we will see information from the Who Attended? field from our Daily Attendance module in our report and we will be able to click to the members contact page because the field is linked.
Conditions Tab
Once we have all of the desired fields in our report, its time to add conditions to that we can narrow down the information that will be given. Here is an example of common conditions that may be used within a report.
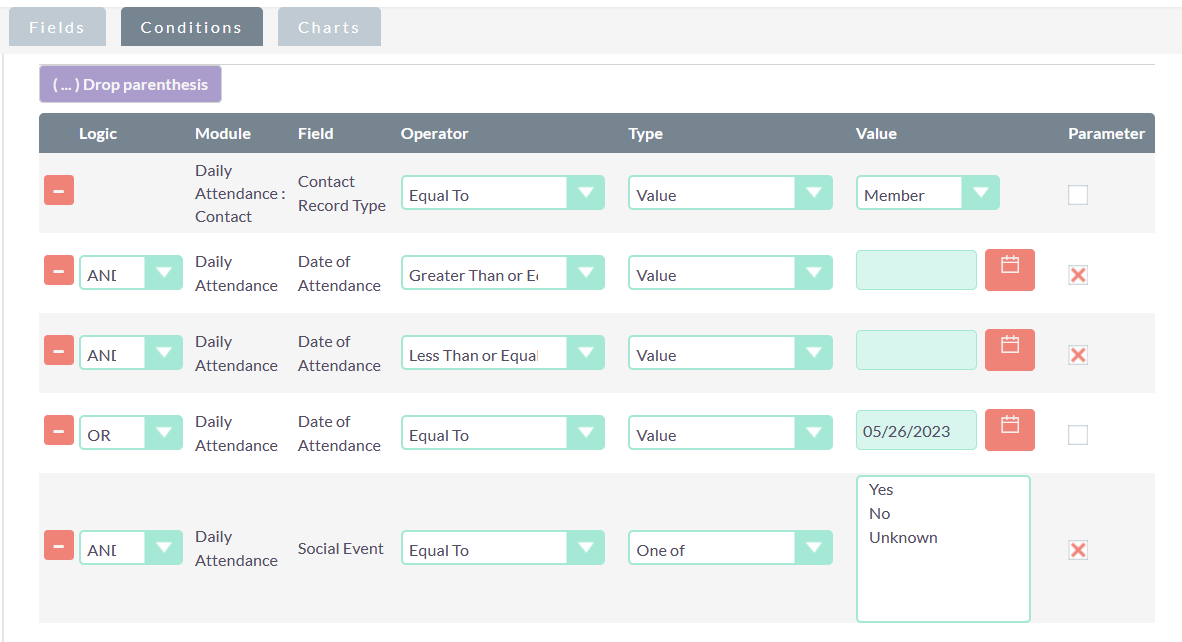
Lets break down the information being show above.
Again we have the minus sign that will delete the condition from the “Condition” tab.
Logic - The logic drop-downs will appear once two or more fields have been selected under conditions.
OR - This means that only one of the condition needs to be met in order for the information to be displayed in the report
AND - This means that both conditions need to be met in order for the information to be displayed in the report
Module - This lets us know what module our field is from
Field - This lets us know the name of the field
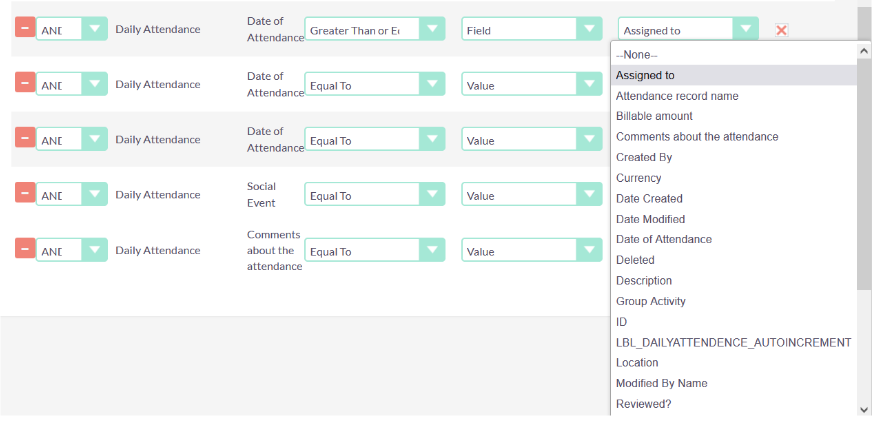
Operator - This drop down containing the operators such as "Equal to" "Not Equal to", "greater than", "lesser than","not greater than" and "Not lesser than". These are just here to be more specific with the information that we want out of our reports.
Type - The options under this column may vary depending on what the field is, changing the
- Value - this is the option that will show the base value of any field meaning, if the field is a drop down the value will be a drop down, if the field is a textbox the value will be a textbox, and etc.
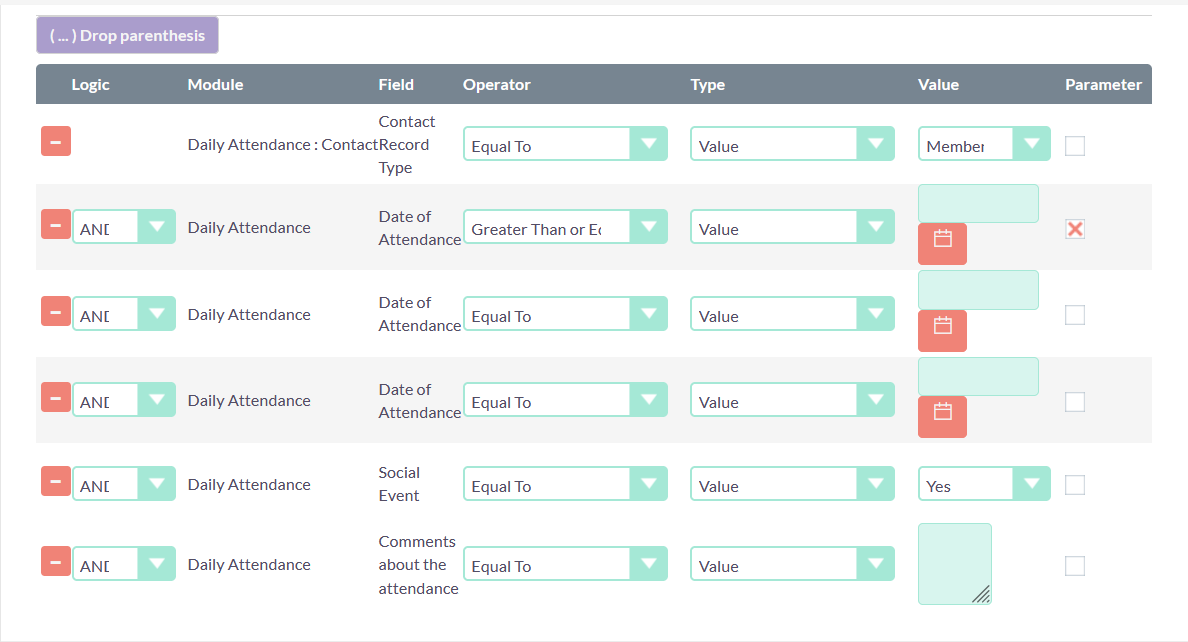
Above is an example of the different options under value based on their different fields
- Field - This option is rarely used in reports as it just shows the other fields that are used with its module, this will be available for any type of field but if the field is a date-related field it breaks the report.
Above is an example of what the type column may look like if you were to select the field option Note: Do not select this option if you have a date or number-related field as it will break the report.
-
Date - This option will only be available if the field is date-related, once selected you will be able to select either now or today with the choice to add or subtract any number from any of the additional options in the additional drop down. The additional options in the drop down include:
- none
- minutes
- hours
- days
- weeks
- months
-
business hours
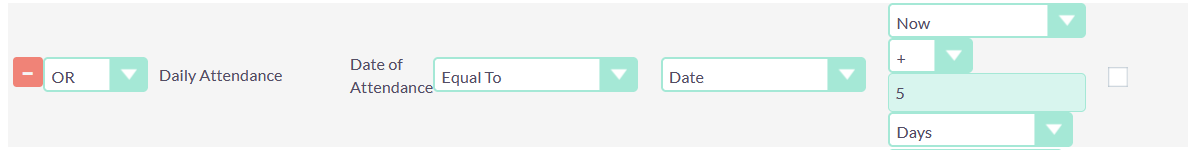
For example this condition is telling the report to show us any “Date of Attendance” equal to today's date but, 5 days from now.
While this condition is very specific, as you will learn there are simpler ways to find this information.
Note: This option will only be available if the field is date-related
Period - If you have your fields type set to period you will see a drop down under the Value column that has the following options:
- Today
- Yesterday
- This week
- Last week
- Last month
- This month
- Last quarter
- This quarter
- This year
- Last year
- One of - This option is only available if the field is a drop down, if this option is selected under the Type column, under the Value column it will show all of the options in that drop down.
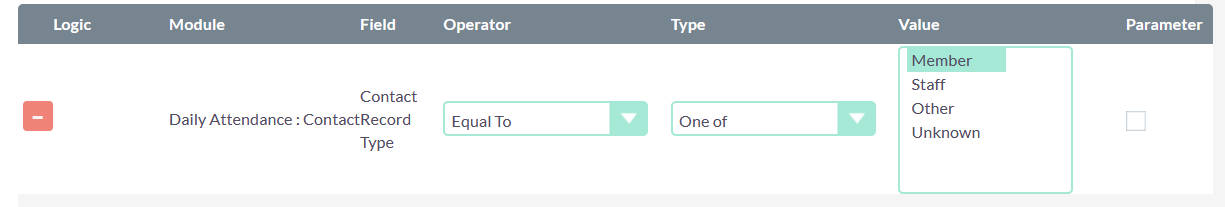
Above is an example of a fields Type being set to One of and the options of that drop down being shown under the Value column.
Parameter - If the checkbox is ticked it will make the condition both visible on top of the report in a box labeled Parameters and you will be able to change the Operator, Type, and Value of the condition. Disclaimer : if you change your Condition to a Parameter you will have to click UPDATE to generate your report, otherwise your report will be empty.
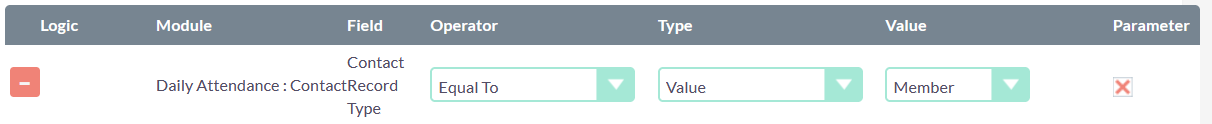
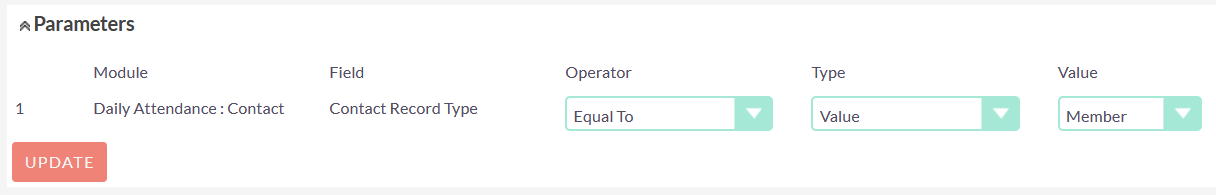
Above is an example of what it would look like for a condition with the parameters checkbox ticked, and how it is shown above the report, as well as the UPDATE button.
Charts Tab
You can add charts to Reports. Charts provide a visual representation of the Report data to you. In some scenarios, or for particular users, visual aids such as charts can assist quicker analysis and better understanding.There are six types of chart that the user can select to display Report data. These are:
- Pie Chart
- Bar Chart
- Line Chart
- Radar Chart
- Stacked Bar
- Grouped Bar
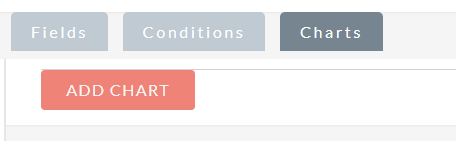
To add a chart, click on the ADD CHART button
Here is what will appear once you click on the ADD CHART button
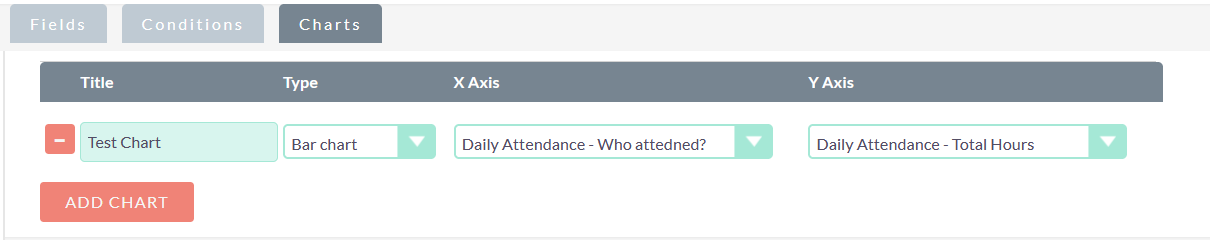
The minus sign next to the row lets us delete the chart from our report
Title - This is the name of the report
Type - Here is where you can select the type of chart from the options mentioned above.
X Axis – Allows the user to select the column that should be used for the X Axis, from the available fields listed under the Fields tab
Y Axis – Allows the user to select the column that should be used for the Y Axis, from the available fields listed under the Fields tab
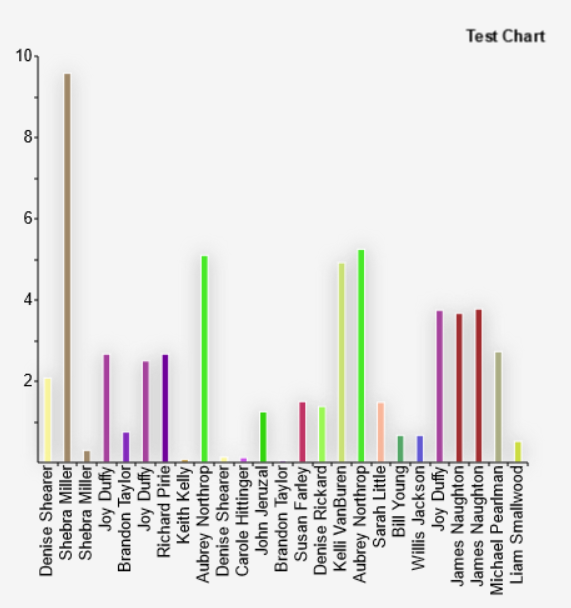
Above is the the chart that we generated earlier, this will appear above the parameters and the report data after we update our parameters.
Actions Tab
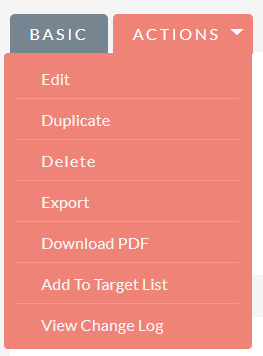
This is the Actions tab., this will be visible after you are done creating your report. Here you are able to edit,duplicate,delete,export, download a PDF of your report, add to a target list, or view the change log of your report.
Edit - Clicking on the edit button will allow you edit the report.
Duplicate - Clicking on this will automatically duplicate the report and open it in the edit mode.
Delete - This button will allow you to permanently delete your report. Please use this with caution.
Export - Clicking on this button will automatically download the report as an excel spreadsheet.
Download PDF - This button will automatically download the report as a PDF.
Add To Target List - This button will open a pop-up that lets you select from a list of different types of targets lists to run your report on. A target list is a pre-determined group of contacts based off shared traits. You will have to already created a target list if you want to use this function.
View Change Log - This button will create a pop-up that shows all of the changes that have been made to this report.
That is all of the definitions that you need to know in order to successfully understand how create a report.